# Drill-down reports
Drill-down reports (or tree reports) provide multi-level data analysis, allowing you to dive into information at various levels of detail and uncover hidden patterns, and relationships between metrics.
In grouped reports, the Tree view is selected by default. Switching to the Table views back and forth is available in Settings.
To create a report:
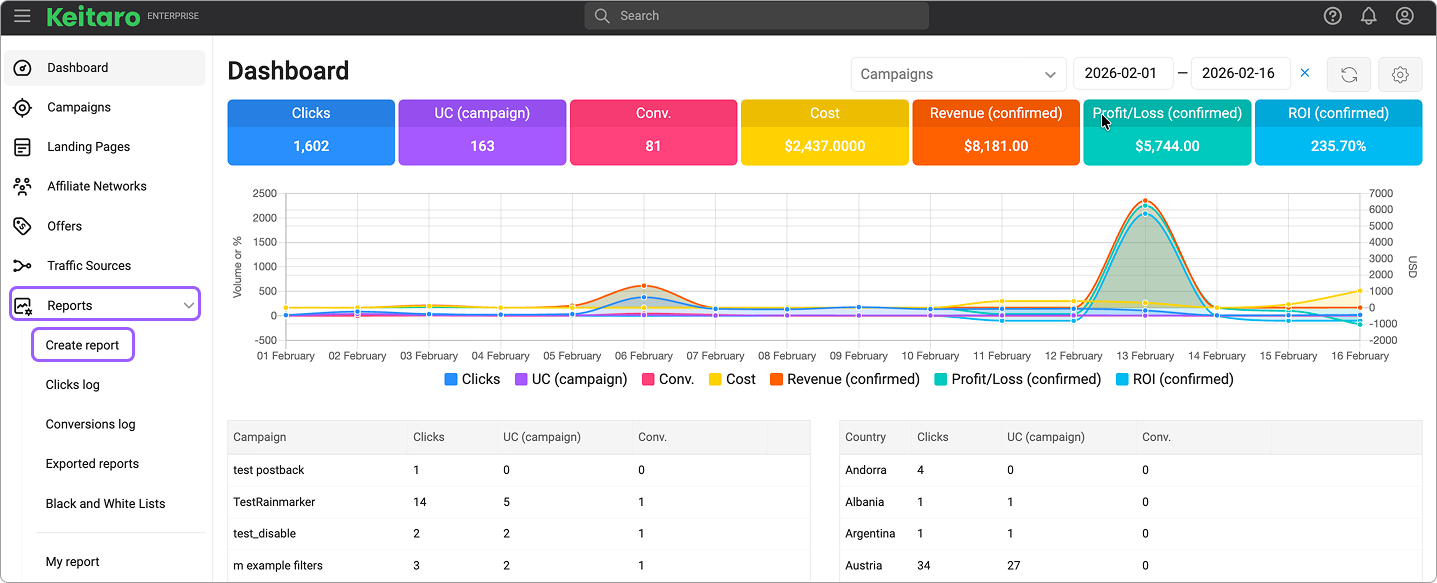
- Click on "Reports" and select "Create Report":
- Go to the "Campaigns" section, check the desired campaigns, and select "Report":

# Features
Drill-down reports show data from summary to detail across hierarchy levels. They help quickly identify the source of changes. For example, if sales decline, you can drill down into categories, products, or regions to see where the drop is greatest.
At each level of the tree report, there is an option to click on a link and open a detailed report on the specific level, allowing deeper analysis of the statistics.
The ability to apply grouping up to five levels, depending on specific needs and goals.
# Functionality
# Generating a link to the full report
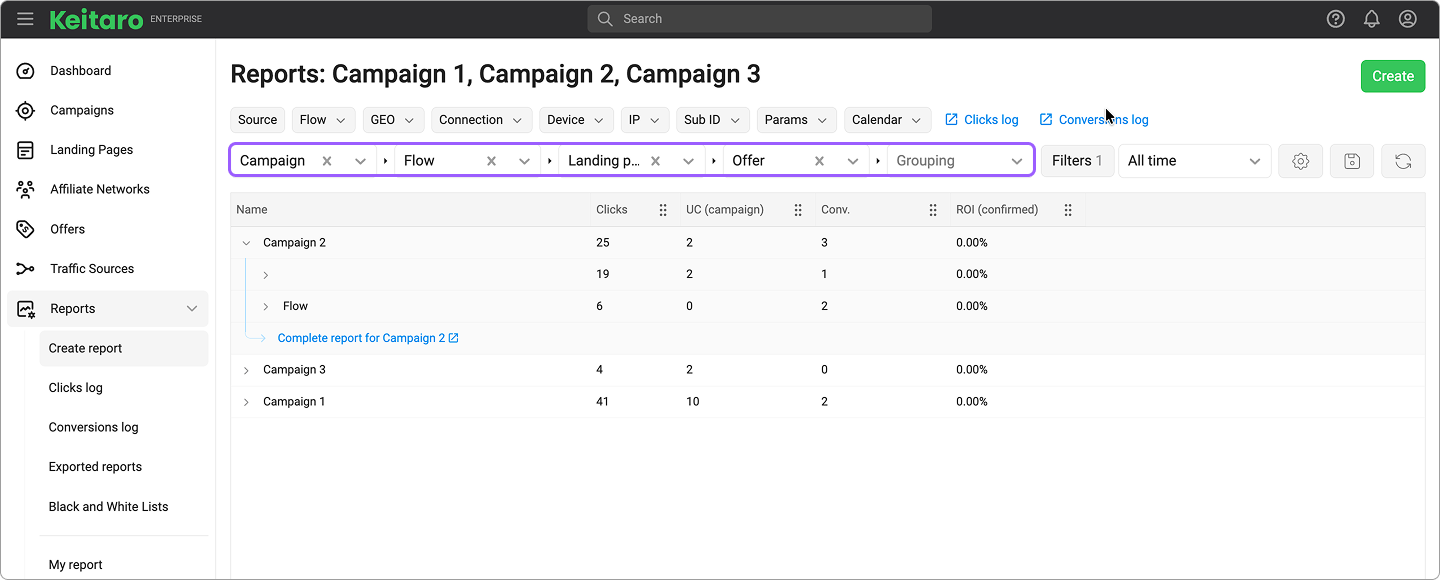
When drilling down into the tree by clicking the arrow next to the value, each following grouping level provides the option to follow a link to the full report to view the remaining data (if the number of values in the grouping exceeds 25) for the specific level.
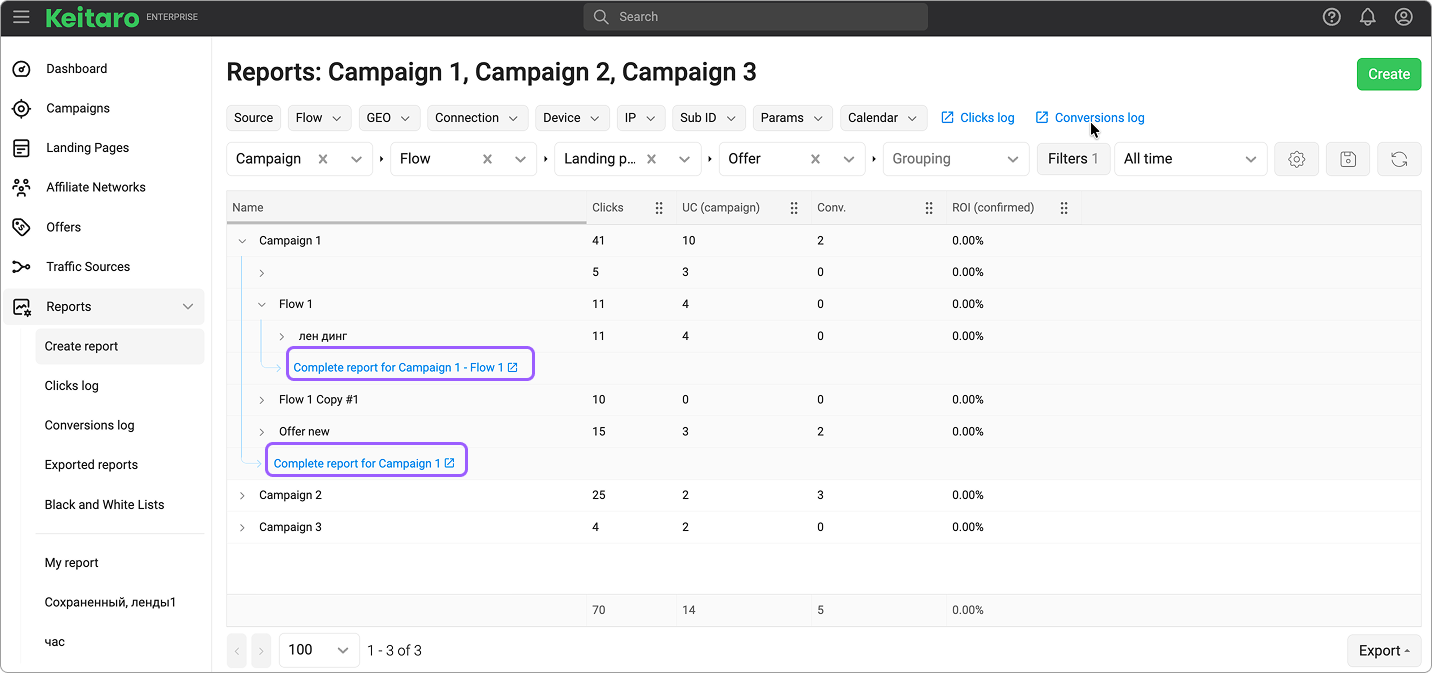
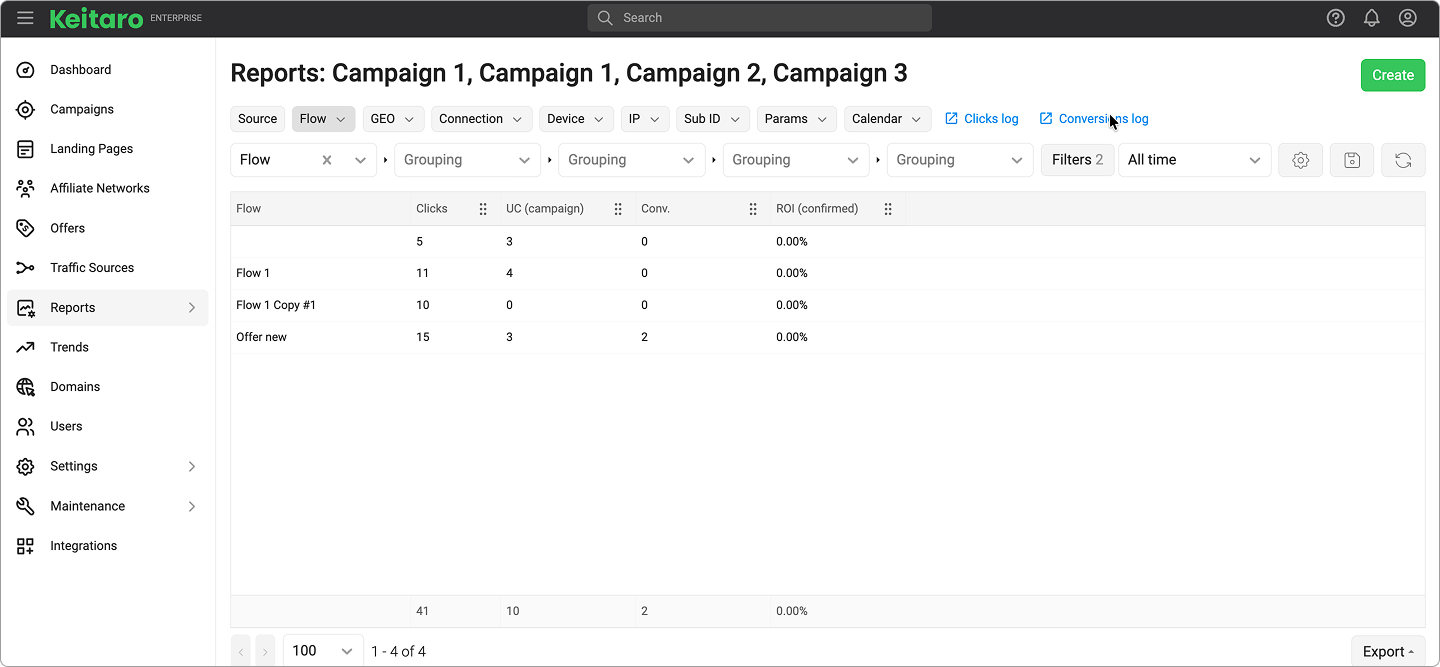
The full report is presented in table format and looks like this (in this case, grouping by flow is used):
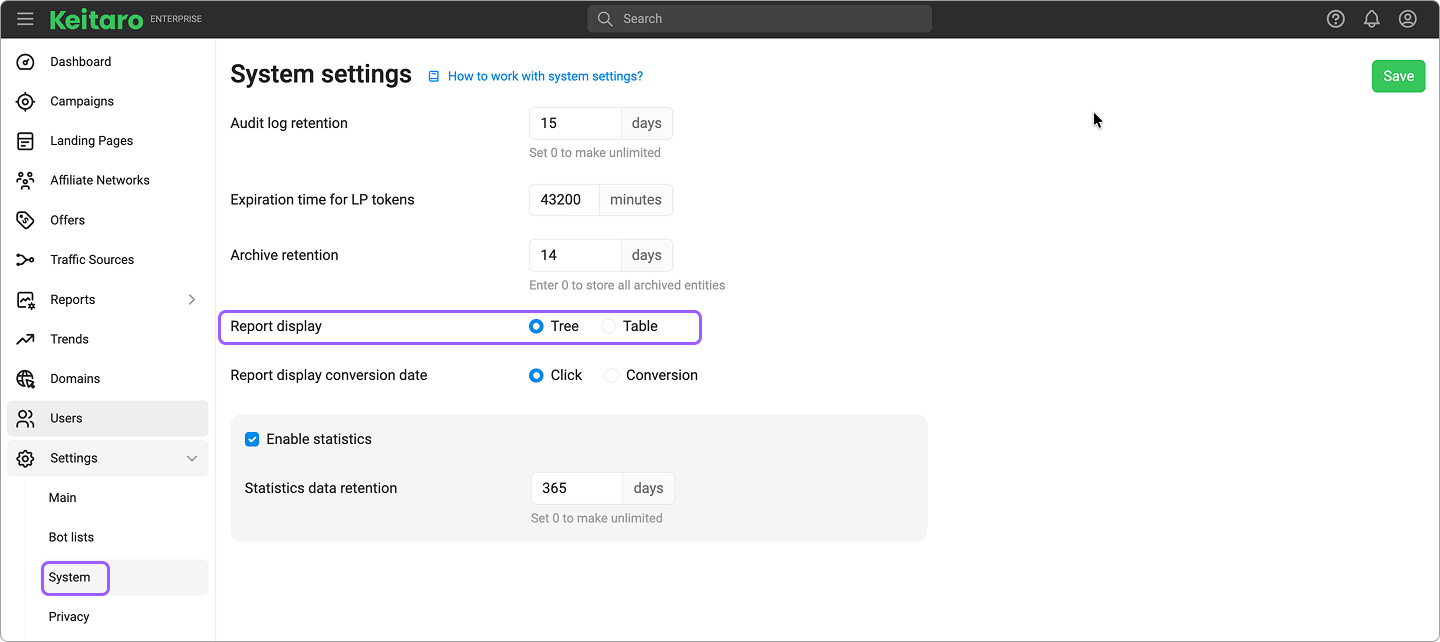
# Switching the report from tree view to table view and back
In the tracker settings (Maintenance > Settings), there is an option to switch between table and tree views for reports: